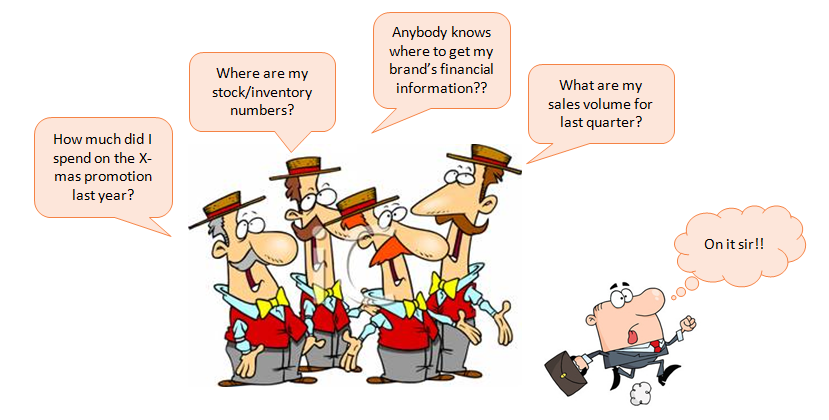
The lives of managers and leaders in fast-moving consumer goods organizations seems to be riddled with data, and that is not from one source or their own business function. Round the clock a lot of hands and minds in these organizations spend their valuable time just tracking every bit of this data or looking for data hiding in some nook and corner.

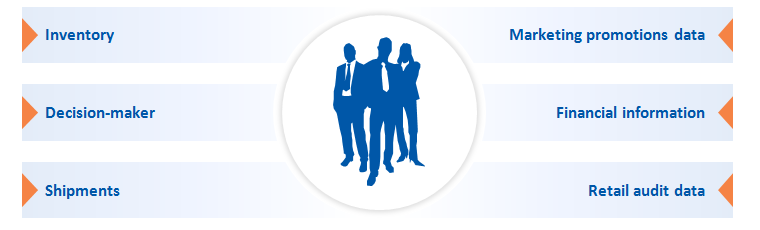
The ever-changing digital landscape hasn’t made it any easier for these FMCG organizations, now on top of the already existing internal and external sales data, disparate marketing promotional data, all-important supply chain data and heaps of financial information; social media has only added to the mass.
What becomes critical now is how to manage, streamline and use this data to benefit each of these individuals and the larger organization; how should these organizations move forward methodically to arrange, re-arrange, sort, filter and make sense of these data mountains. This is where we introduce ‘Data Harmonization’ and let’s not get technical about it right away. Here are some mind-boggling facts to indicate the necessity of this concept:
- According to estimates, the volume of data collected by businesses worldwide doubles every 1.2 years.
- Poor data or ‘lack of understanding the data’ are cited as the primary reason for overrunning project costs and could cost businesses 20%–35% of their operating revenue.
The real need becomes to first understand the fundamental data sets that such organizations need on a day-today basis, put them in blocks or sets in a meaningful manner and put them in a place which is accessible and manageable from an operational standpoint. For now let’s not even think what Analytics am I going to run on these or which tool is going to store and keep munching away this data.
- According to Gartner, the worldwide business intelligence market was worth over $14.4 billion in 2013, an increase of 8% on the previous year ($13.3 billion).
- This figure is predicted to reach $20.81 billion by 2018, equating to a compound annual growth rate (CAGR) of around 8.28%.
Though these facts are great positives for players in the BI industry but a more important fact is to wake up CPG organizations and bring them face-to-face with ground realities about the state of their data and data readiness.
From what we have seen and understood working with these consumer goods organizations is that they still do not know what all data exists in multiple silos of their offices. Even if they manage to track it down, most of the data does not talk to each other and finally there is no guarantee on the sanctity of the data emerging from various machines.
A large CPG conglomerate with which we run multiple analytics projects, spent more than half its time in all projects providing data from internal and external sources; most of the times the data had to be revised numerous times before it could be used as inputs. This is a typical concern area we have seen with other CPG clients as well; the problem arises not because of lack of data but largely due to a lack of a simple central repository.
Here is a quick guide to begin putting things in order:
STOP & THINK: Though time is of the essence in today’s business world, but there is no harm stopping to think for a while and pondering over what is really important to you and your business. Get a sense and understanding of the data you generate and that which you really need (remember even all food that you intake does not get digested by the body)
START SIMPLE: Begin collating basic data which gives you an understanding of all the vital parameters of your business (the doctor doesn’t put you on the operating table as soon as you enter the room). Forget all the fancy software names companies put out there to make your redundant data look fashionable, Excel still works great to begin with!!
THINK AGAIN: Now that you have your basic set done with at one place (worksheet for now is fine). Think about elements from a few more sources which can supplement or complement the existing data set. Still do not go out of your away and try to bring the universe together.
EVANGELIZE: Once you are ready with these elements, there is no harm to evangelize this with the larger teams, let’s use some basic technology now and put this out there online where people ‘See it’ and begin to ‘Believe it’!!
PRIORTIZE: As your data harmonization cycle begins to move away from its infancy, now may be a good time to prioritize certain key performance indicators (and here let’s not keep adding to the existing list), the keyword here is PRIORTIZE.
While on this journey, as the data universe in your business begins to make sense and you can easily navigate and see through the clouds, it may be time to climb up the next step.
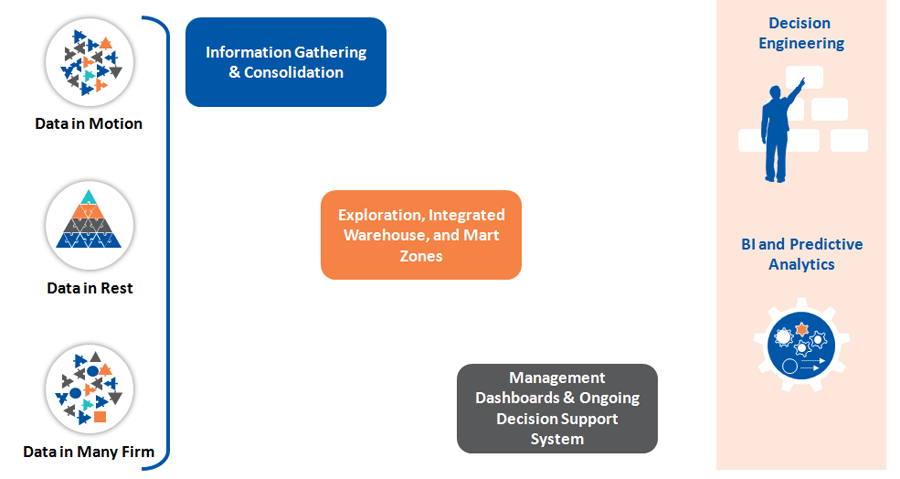
While some organizations have only started on this journey, one of our biggest clients is well on its way on having a global centralized data repository for all their sales, consumption and marketing activities data. Every country, region, category or brand can log-on and access their data on real-time basis across devices.
A few more impact areas are:
Financial: A great tool that has allowed the teams to save significant time being spent report creation and even for data confirmation for doing any analysis. A client testimonial reads;
“ Thanks you decision planning tool, we now have most of our data sitting & residing in a single place, which has helped my team deliver projects faster and with strong buy-in from stake-holders, In fact the automated reporting from the system to users’ mailbox has allowed my team to spend more time on analyzing than doing mundane manual work. I look forward to version2” the client organization was able to save 50% of the time of any / most of the analytics project + reduction in report creation from 1.5 weeks to 4 hrs.
Embeddedness: Giving a cross functional team a good perspective & view towards a holistic picture of the business. Not just sales, or value but also the elements that are driving the sales across the organization. Yet another quote on its impact from one of our clients;
“The current dashboard has not only helped our teams, but elevated on how they look at the business, and now ask & generate questions with hypothesis. This is going to significantly impact our business performance”
The key in the data harmonization piece is to build out the data universe in a manner which helps you traverse the decision-making journey in a simple yet effective way. While you continue to add layers to your data (and believe me this never ends), you would have learnt by now and put in a process to only let the good ones get in.
Other reading material :


