Want to build an accurate model? Rely on technical knowledge. Want a model that’s effective and usable? You’ll need a lot more than just technical chops.

We’ve seen it over and over again: predictive models that don’t work. Maybe they’re making false predictions. Or they’re accurately predicting something quite irrelevant. Or, sometimes, models can be very accurate – and so very complex that people don’t use them.
Models that don’t work for users are not useful. And nobody wants to waste time and money developing a non-usable model. So, what can you do to ensure your model a) works correctly and b) meets your company or client’s needs?
7 Steps to More Effective Predictive Modeling
Building a predictive model is an art. It’s also a process. In our experience, it’s often the basics that get overlooked. So, here are our (common-sense) steps to building a better model:
-
-
Be sure everyone understands the business question.
It’s tempting to jump right into a modeling project, especially if you think you know what’s needed. But you may not know that as well as you think. Your client may not know what they really need or want. So, ask. And ask. And ask again. Reframe and restate. Ask in multiple ways. If you don’t understand the problem, you won’t be able to build the model.
This helps your client, too. They may not realize how vague their goals are! Make sure both parties understand why the model is needed and how it will be used.
Once you understand that, you can build a clear mental predictive framework to answer the business question. This requires translating the business problem to an analytical problem, which means doing a thorough analysis of the data.
-
Do an exploratory data analysis first.
Now that you have a clear idea of the business need, get to know your data. This step will save you time in the long run, so don’t gloss over it in your enthusiasm to start building.
Use business understanding to guide your analysis.
It’s not enough to simply look at trends; you should understand the relationships between variables. Decompose the problem’s components and see what’s really happening. For example, suppose you’re exploring the relationship between revenue, traffic, price, and incidence in a retail outlet. Look at the different segments – i.e. high-traffic vs. low-traffic stores, stores in high-price areas vs. stores in low-priced areas. There will be different patterns there. Figure out where the drivers fit into your data.
Develop a hypothesis before starting modeling.
Before you model, create a simple chart of your data and study it. You’ll learn a lot! You may get a good idea of the answer to the business problem based on the overall trend. At the very least, charting will give you a feel for the relationships between variables. And it will help you spot problems with the data before you get into the actual modeling.
Charting data can also inform your choices of modeling techniques. For example, if you see a non-linear relationship between variables, you won’t use a linear regression model.
Understand the interactions between the variables.
If you don’t understand how the data is behaving, you won’t be able to build a good model. It’s as simple as that.
Look for the not-so-obvious connections. Dig deeper to understand the relationships. For example, we generally accept there’s a negative relationship between sale quantities and price, but that’s not always the case. For some items, a closer examination shows that this accepted theory doesn’t tell the full story at all price points. -
Simpler is usually better.
Resist the urge to plan a complicated, highly technical model just because you have the skills to do it. Consider your user groups: those newer to analytics probably need a simplistic model; experienced analytics consumers might be comfortable with more detail.
More complex models are not always more effective. Simpler models are generally easier to understand, which makes them the most effective for business users. People can see the relationship and quickly assimilate it.
-
Use an iterative model development process.
No one has ever built the perfect model in one shot. Refinements are part of the process. So, revisit your model frequently. If there are problems, be proactive: find another technique, look at another variable. Look at your test data and predictions – are they all wrong? Or are certain data types having issues? Did your model work for some time periods and not others? It’s normal to have problems during the build process. Look at them as a chance to improve your work.
-
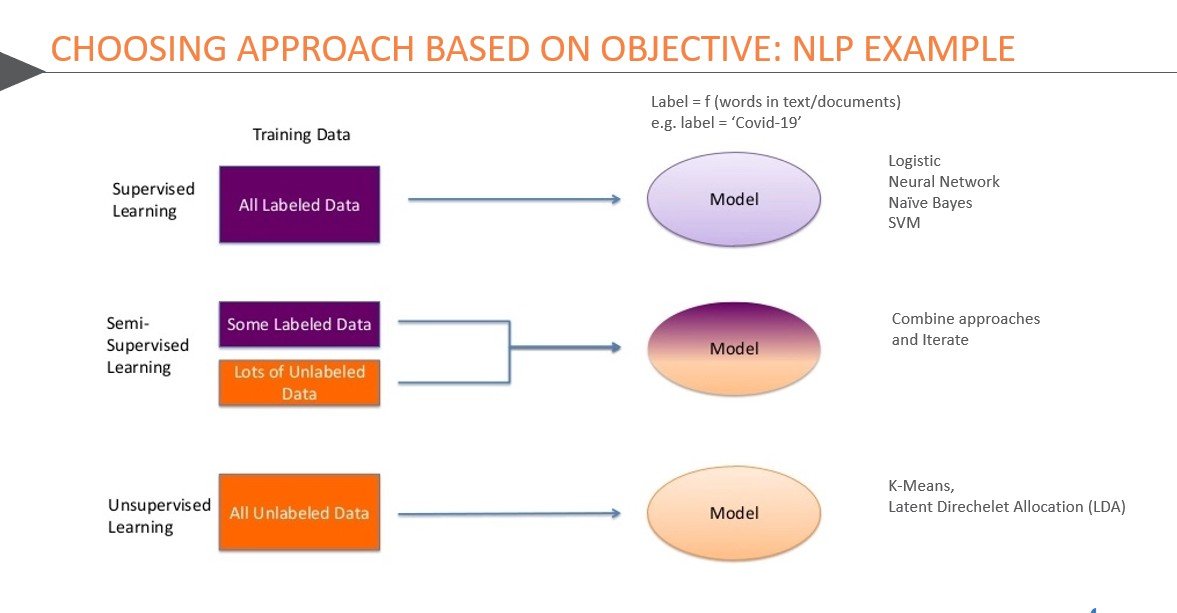
Understand which techniques are better for which problems.
As humans, we like to use what we know. And we really like to use techniques we’re good at. This can cause a problem in predictive modeling since different data types respond better to different modeling techniques.
So, base your approach on the objective and the data you have. For example, supervised learning, semi-supervised learning, and unsupervised learning work with different data types. It’s important to make the right choice for your data, as shown in the table below.
And, as you know, there are many options for building a neural network! Again, it’s vital to understand your data and the ultimate use of the model to make the best choice.
-
Prepare for the trade-off between interpretability and accuracy.
There will always be a trade-off in a predictive model: interpretability vs. accuracy. The more detailed and technical the model, the higher its accuracy. Unfortunately, there’s another correlation between detail and technicality: the higher its levels, the less usable the model. To create a useful model, simplification may be needed.
The deciding factors are the user audience, the client, whether the model is for a product or service, and its scalability. Will simplicity and interpretability be more helpful than higher accuracy?
Also, consider the scope of the business question. If you’re looking for the big picture, you may need multiple models to understand the full situation. Will higher levels of detail be helpful in such a model?
-
Build a narrative.
Data points tell a story, but it’s not always a complete story. You may have to connect the dots for your audience, especially if you’re using multiple models.
Throughout your analysis, keep the problem (and thus the story) clear in your mind. Focus on the main theme. Identify the main messages and sub-messages you want to share. Then you’ll build trust with your audience and create an effective predictive model.
Listen to the entire webcast here and hear our experts share their experiences in building predictive models over the years. Take along the learnings and become a modeling ninja!
-
Related Absolutdata products and services: AI & Data Sciences, NAVIK AI Platform


