Vivid Visualization | Deciphering the 4 main components of Fuzzy methodology
Interpretation alone doesn’t necessarily lead to an accurate or wise judgement. There are usually many options between yes and no. This broad spectrum of options, which are not fully yes and not fully no, can range anywhere between those two absolutes. This is the concept of fuzzy logic; the degrees of our answers makes it all fuzzy or vague.
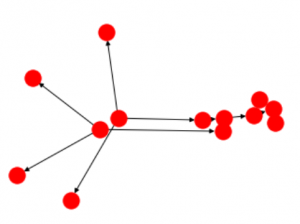
The architecture of fuzzy logic is depicted in the figure below. The numbers corresponding to different features of this system will be referenced throughout this article.
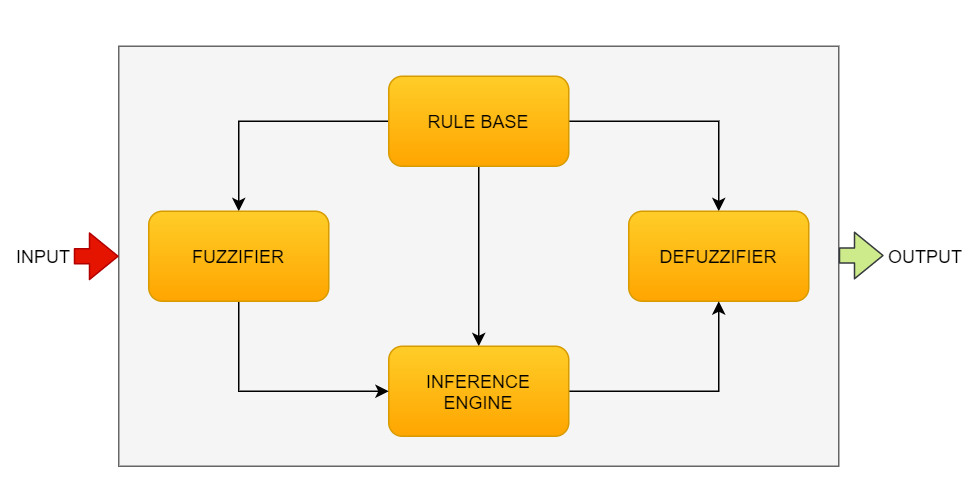
Image1 adapted from Geeks for Geeks [1]
Fuzzy logic helps us model the uncertainty and vagueness in the basic human responses which serve as our inputs [1]. All our inputs have a characteristic of degree of membership, in that we approximate the association of an input to a fuzzy set. The value of this measure is anywhere between 0 and 1; 0 indicating no association to a certain fuzzy set and 1 meaning that it belongs to this fuzzy set. Any value between 0 and 1 is treated with uncertainty [2]. The .view attribute in the skfuzzy Python library helps us view different elements modelled in fuzzy logic [3]. We will use this attribute to visualize our use case.
The Tipping Problem (Use Case)
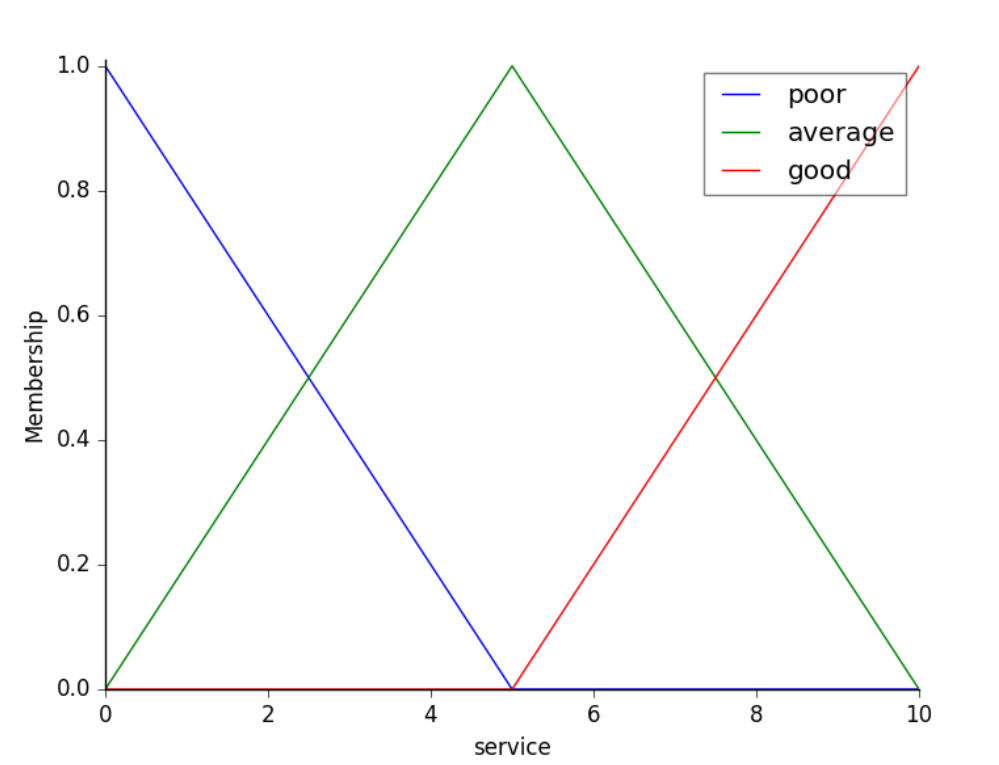
Taking the example as implemented in the .ipynb file[3], we will visualize the functionality of a fuzzy logic system. Here we have to determine the ‘tip’ (2) with the help of ratings given on the ‘service’ and ‘quality of food’ (1). The ratings for both our inputs could vary between 0 and 10, however we use (5) to convert our numeric values to fuzzy sets (labelled poor, average, and good). Then we can view the associated degree of membership in adherence to our varying inputs:
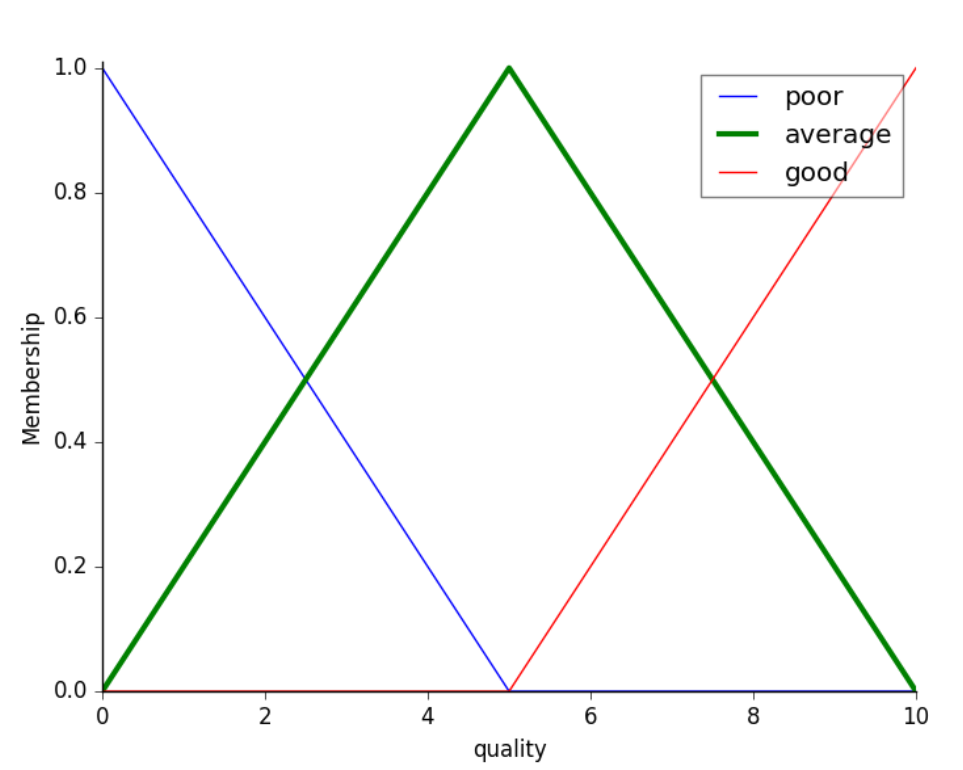
Image2, Image3 from skfuzzy [3]
Once our inputs have been defined, a relationship needs to be defined between (1) and (2), which then forms our rule base (3).
The rules for the tipping problem could be a good tip for good service and food, an average tip for average service, and a poor tip for either poor food or poor service. The complexity of rules really depends on how robust a controller we want to design.
Fuzzy logic is excellent at translating these imprecise rules into a form that gives the controller an actionable insight[1], i.e. a discrete value of the tip. The .view() attribute allows us to visualize the rules interpreted by the controller. See the figures below:
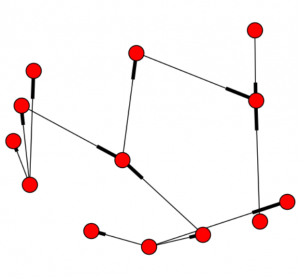

Image4 adapted from skfuzzy [3]
The interpretation made by the controller to learn the association of the inputs and the outputs is called the inference engine (4). This plays a role in deciding the action made by the controller.
After the above steps have been followed, we have a complete fuzzy-enabled control system which can now be used to simulate a response to new numerical inputs, i.e. ‘9’ for service and ‘6.8’ for food. The black line shows the defuzzified (6) final output, i.e. the tip in numerical terms.
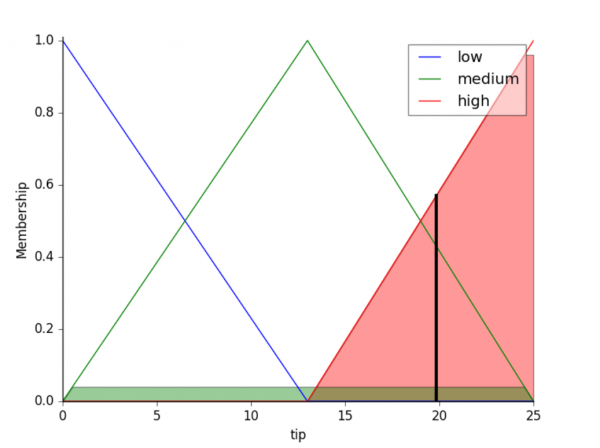
Image 5 from skfuzzy [3]
Click here for the Jupyter Notebook with the implementation of the same in Python
References
- [1] “Fuzzy Logic Introduction” GeeksforGeeks.com
- [2] Cox, Earl. The Fuzzy Systems Handbook A Practitioner’s Guide to Building, Using, and Maintaining Fuzzy Systems
- [3] “Fuzzy Control Systems: The Tipping Problem” SKfuzzy Documentation
https://pythonhosted.org/scikit-fuzzy/auto_examples/plot_tipping_problem_newapi.html
Technical articles are published from the Absolutdata Labs group, and hail from The Absolutdata Data Science Center of Excellence. These articles also appear in BrainWave, Absolutdata’s quarterly data science digest.