Vivid Visualization | Robotics and Q-Learning in Reinforcement Learning
Robotics
Robots are capable of extraordinary things. We see them in sci-fi movies and in other works of fiction, where their capabilities seem unimaginable. In real life, their potential as machines that work like humans fascinates everyone. But what gives them a mind? They simply work according to programmed instructions. The inability for robots to work to their potential is a software problem, not a hardware one. This is where reinforcement learning begins to redefine things for us.
Reinforcement learning goes one up on supervised learning. Basically, it doesn’t just imitate already-seen outputs – it can also self-correct.
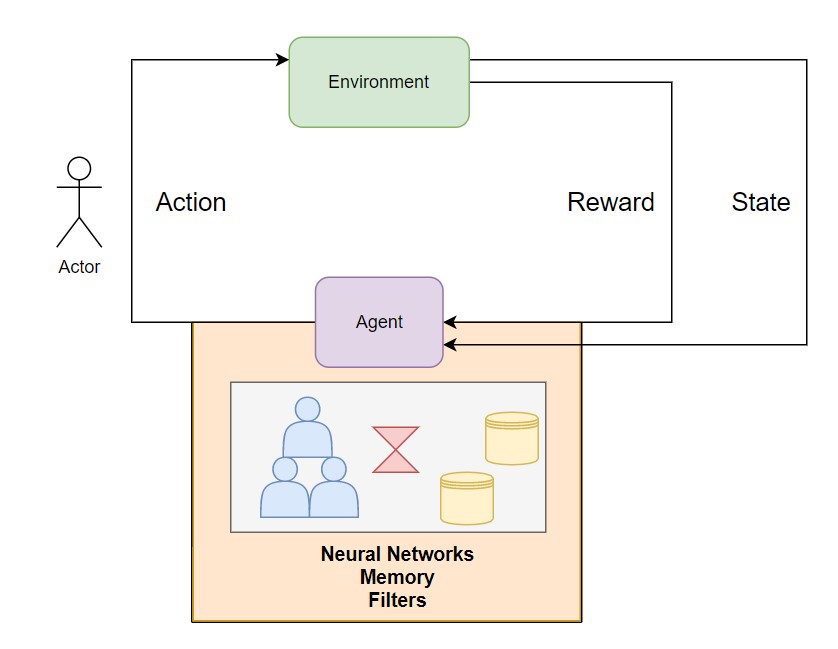
Figure 1: Overall Architecture of Reinforcement Learning
In the diagram above, we define the general flow of reinforcement learning. We have an environment; let’s suppose that’s a game where you have to score some points. We won’t have an input data stating that if we did a particular action it would lead to a particular output. Instead, we have a reward linked to the output from the environment (i.e. the game). The agent will learn from the rewards that it registers; its point total increases as it chooses the correct action; if it chooses a wrong action, the point total decreases. On the basis of the agent’s actions and the results generated by the environment, a new action is developed according to the current state of the game; this will also go as an input to the agent. This process will keep happening in iterations, and we could boast about our otherwise simple robot as a state-of-the-art robot.
Q-Learning
Q-learning is one of the most popular learning algorithms used to train agents. It uses Q-values Q(S,A), also known as action values, which estimate at any given state S how good action A is. This algorithm tries to find the optimal steps/actions by learning the optimal Q-values. It essentially tries to model environment into a lookup table of Q-values for different states and actions. This lookup table is also known as a Q-table.
At the start, the Q-table will be initialized with 0 Q-values for all the states and actions (as shown below on the left). During the learning process, it will iteratively try to find the probability of an action’s success based on the reward given. At the end, it tries to determine the agent’s policy, i.e. the action an agent should take at every given step to maximize the reward (as shown below on the right).

Representation of a Q-table at starting.

Representation of a Q-table after learning.
References
Authored by Sunny Verma, Data Scientist at Absolutdata