Vivid Visualization | Visualizing the Blockchain Network
One of the fundamental pillars of blockchain is transparency, and this transparency allows us to access a whole range of data about the blockchain network to create vivid data visualizations.
Bitcoin and Ethereum are the biggest applications of blockchain technology. Thus, most of the interesting visualizations we will talk about here make use of their networks; however, most of these visualizations can be ported to other blockchain applications as well.
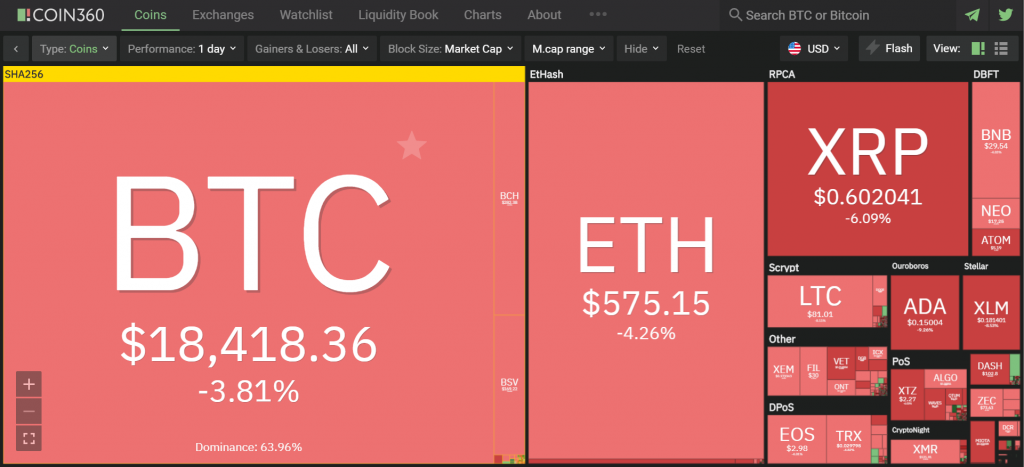
Market Capitalization and Volume
The main page of the website coin360.com has a live heatmap of different cryptocurrencies’ market capitalizations. The colors of the blocks signify market movement: red for price decline, green for price rise, and gray for price stagnation. The size of the block corresponds to the market capitalization of each currency. The heatmap gives us an interesting perspective of the data generated by cryptocurrencies and shows us which currencies dominate the cryptocurrency ecosystem.[1]
Recent History
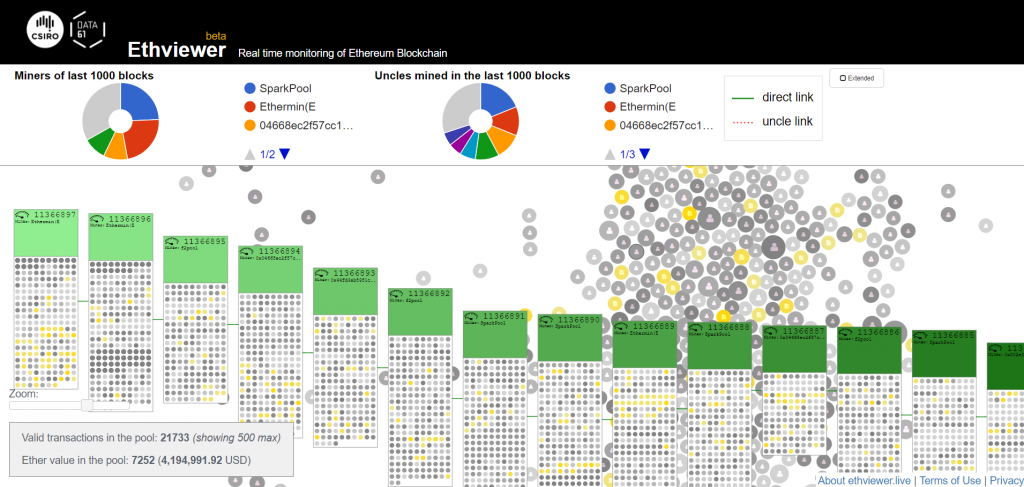
Given that blockchain technology is completely transparent, we can view all the transactions in real-time. The site ethviewer.live takes this real-time data and visualizes the 24 most recent blocks of the Ethereum blockchain. The multiple transactions that make up each block are represented as circles inside the block. The circles behind the blocks are the transactions that are waiting to be included into the block.
Ethviewer shows an animation whenever a waiting transaction is assigned to a block. By clicking on any transaction, you will be directed to the relevant etherscan.io page, where you can view more information about that transaction.[2]
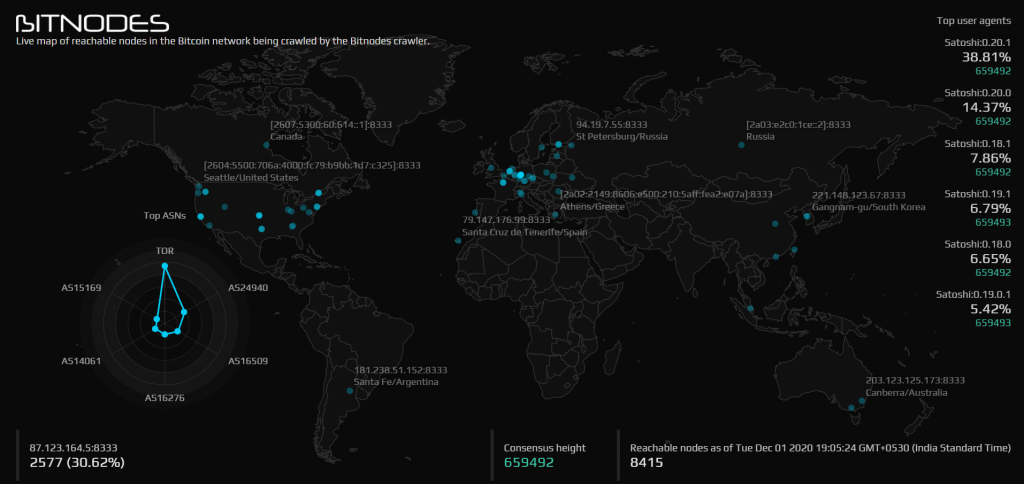
Network Maps
In the Bitcoin network, a node is any program or computer that fully validates transactions and blocks. Bitnodes.io finds all these nodes in the network and estimates the size of the Bitcoin network. This website shows a live map of all the reachable nodes, which allows us to get a high-level view of where most transactions are being validated. [3]
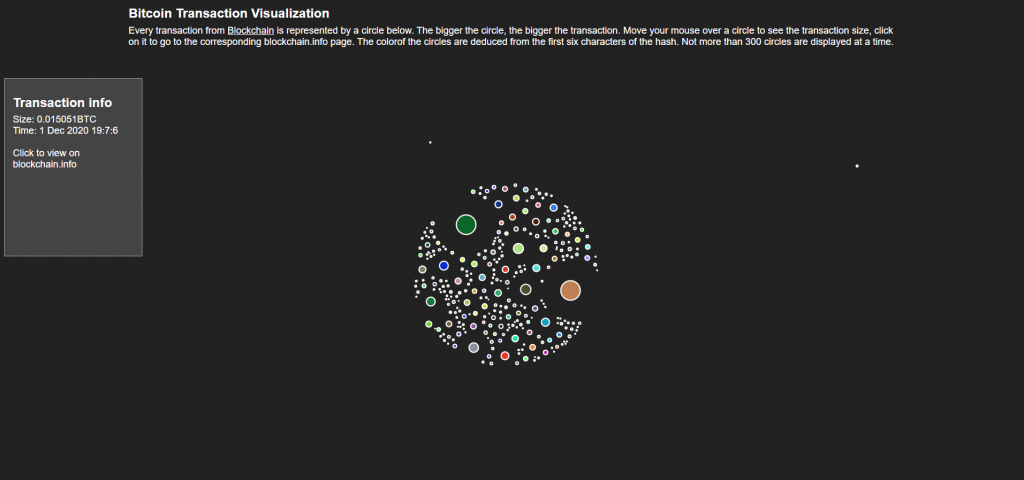
Live Transactions
The website , like ethviewer, visualizes Bitcoin transactions, but here the size of each circle represents the size of the transaction. Again like ethviewer, you can click on a transaction to open the relevant blockchain.info page and view additional information about it. [4]
References